Grids are specially designed screens that have been provided to make the editing of any of the curriculum dataset records as easy as possible. The grids are designed to display data in a spreadsheet type view, that is: in columns and rows. The rows are the individual dataset records, one per record, while the columns are the individual dataset fields.
To view all of the records in the current dataset, press Enter or click on the Search button in the condition builder.
The data is displayed in a scrolling grid, where columns on the left-hand side can be fixed in place so that you can always see the context of the data you are working with.

From the grids, you can:
To sort the data, click on the header of any of the columns displayed and the data will be displayed in ascending order by that column. Click on the header again to switch to descending order. To sort the data on multiple columns sort on the first column as described above, then Ctrl-Click on the header of the next column to sort by (hold down the Ctrl key on the keyboard while clicking with the mouse).
To scroll through the data horizontally, use the Tab keys or the arrow keys to move across the grid one cell at a time, or use the horizontal scrollbar at the foot of the grid to scroll the data without moving the cursor from the current cell.
To scroll vertically, use the up and down arrow keys or the vertical scrollbar on the right of the grid.
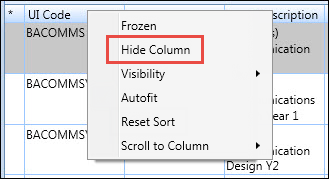
You can configure the columns in a grid by right-clicking on a column header to display the column shortcut menu.

The options on the column header shortcut menu are described in the following table.
| This option | Does this... |
|---|---|
| Frozen |
Freezes the selected column to the left of the screen. The shortcut menu will then display a tick when the column is reselected, to indicate that the column has been previously frozen to the left of the screen.
|
| Hide Column |
Hides the selected column in the grid. You can then work with just those columns which are required at the time.
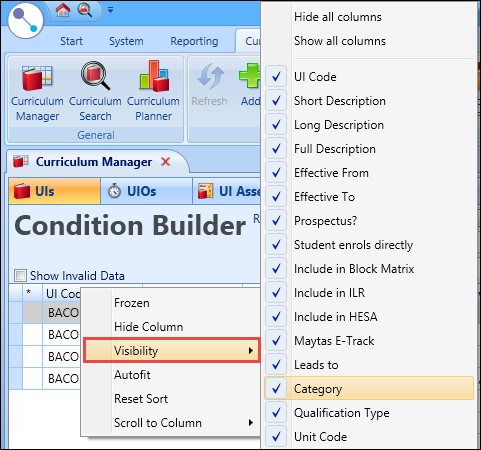
Click the Visibility option in the shortcut menu and select the required column from the list to restore a column to the grid. |
| Visibility |
Displays a list of columns in the grid. The currently displayed columns are shown with a tick against them.
Individual fields can now be selected to hide or display that column in the grid. Any number of fields can be selected in this way. |
| Autofit |
Resizes each column to automatically fit the data it needs to display.
|
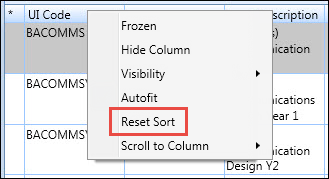
| Reset Sort |
Resets the column data to the order it was originally displayed.
|
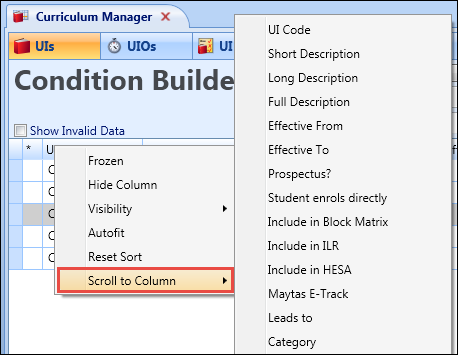
| Scroll to Column |
Scrolls to the selected column in the grid. The columns available in the grid are dependent on the configured columns.
|
To move a column, click in the column header and drag it to the required position.

To resize a column, click on the right of left side of the column header and drag it to the required size. The column headings will wrap or resize to make the optimum use of the width available.

Editing data in a grid depends on the data type of the chosen column. For text and numeric values, click or tab to the required cell and type in the new value. When you move to another cell, values that have been edited but not yet saved are indicated by a green background on the edited cells.

The pencil icon in the far left column of the grid indicates that the row has been edited, even if the edited column is scrolled out of view.
You can toggle the grid to show only edited-but-unsaved rows by clicking on the * (asterisk) header in the first column.
If you navigate away from the grid without saving the changes, you will be prompted to save them.
The methods of editing data in a grid are described in the following table.
| For this data type | Edit in this way... |
|---|---|
| Text or numeric values | Click or tab to the required cell and update the value directly in the cell. |
| Binary (Yes or No) values |
If the field is a Yes or No type value (for example: a Delete Flag), the actual value will be displayed in the cell as Y or N. However when the cell is clicked in to update the value, a check box will be displayed. Toggle the check box to the required value. When you move to another cell, the Y or N value of the check box will be displayed. |
| Lists of values |
Many fields of the respective datasets can only have one of a limited range of possible values. In these cases, tab or click on a cell and type in the correct value if known. If the field value is populated from a list of values, a Search button will be displayed next to the current value when the cell is selected. Clicking the Search button will display a search screen, where you can select the required value. |
| Dates | If the field value is a date, the Calendar button is displayed next to the current value when the cell is selected. Either enter the required date directly into the cell, or click the Calendar button which will display the date selection control and select the required date. |
| Editing multiple rows |
To set a single value for several rows on the current screen (for example: to set the Include in Block Matrix check box to Yes), first select all of the cells that you want to change by using Shift-Click to select contiguous cells or Ctrl-Click to select separate cells. The selected cells will be indicated on the screen by a coloured border. When you have selected the required cells, enter the required value in the first cell selected and use the Flood Fill Down function. The value entered will be applied to all of the selected cells. |
Use the Flood Fill option to make global changes to all the records selected in a column. You can use the Condition Builder to search for records. You can then populate any field in the grid with data, and use flood fill to fill all the records in the corresponding column with that piece of data.
Flood fill is not restricted to the rows currently displayed on screen, that is: the screen may be displaying 50 records, but there may be 250 in the currently returned search. Flood fill will populate all 250 records in that case.
To use flood fill:
- Select a cell in the grid, and then change the value as required.
- Select flood fill by doing either of the following:
Click the Flood Fill button on the ribbon

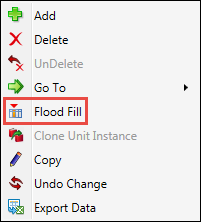
Right-click and select Flood Fill from the shortcut menu
The Copy Selected Value window is displayed.
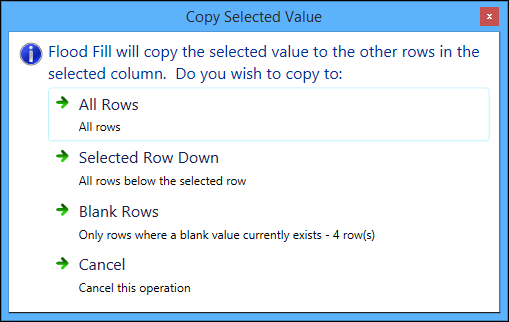
- Select one of the following options:
- All Rows - copies the selected value to all rows in the current dataset
- Selected Row Down - copies the selected value to all other rows from the selected cell downwards in the current dataset
- Blank Rows - copies the selected value to all rows in the current dataset where the value is currently blank or null
The updated cells in the column of the dataset are then coloured green to show that they have been edited.

If other data cannot be updated, cells are coloured in yellow. Hovering the cursor over such a cell will display a tooltip explaining why the cell cannot be updated.

In the grids, the flood fill updates are not applied immediately. This means that you must save the edited data.

